How to Fight Off Bad Ads Without Hurting Ad Revenue

Ad quality has hit an all-time low in the mobile apps industry. We covered this in depth in one of our previous GameBiz AdMon Newsletters, breaking down why ad quality matters, how bad ads drive churn, and how various ad networks stack up on metrics like CTR, auto clicks, ad duration, and churn. In this article, we walk through a real-world example where we helped a client improve ad quality without negatively affecting ad revenue.
1. The Inventory
- Apps: Three F2P (Free2Play) mobile games. Sitting somewhere between hyper-casual and hardcore on the spectrum, they lean toward the casual/core side.
- Mediation: Applovin MAX
- Ad networks used: 11, including Applovin, Google AdMob, UnityAds, ironSource, Liftoff Monetize, and others.
- Ad formats used: Rewarded video ads only
- Geo distribution: 40% - 50% of ad revenue comes from English-speaking countries (United States, United Kingdom, Australia, Canada, New Zealand, Ireland)
- Primary monetization source: IAP (In-App Purchases). Ads make up a much smaller portion of revenue, but still a significant one.
2. The starting setup
The initial setup was default in every sense. That means:
- No blocked categories
- No blocked advertisers
- No blocked apps
- No changes to the default ad network templates
3. The Experiment
We agreed with the client that it was time to take some steps to improve ad quality, and by extension, the experience players were having with ads. This was particularly important given that the games generate most of their revenue through IAPs, so reducing the risk of ads pushing paying players away was a big priority. So what did we actually change?
- We blocked the most problematic ad categories: alcohol, tobacco/cigars, sexual references, drugs, and supplements. The goal was to stop showing these ads entirely.
- We updated the default ad network templates. Some networks let you make these changes directly from their dashboard; others require you to reach out to a contact at the network and submit a request.
The changes were applied at the account level, which meant they affected all games. For the analysis, we focused on the three largest games in the portfolio.
As most people in this space know, this type of experiment can’t be run as an A/B test; with limited exceptions, these controls are set at the app level within each network’s dashboard. We had to measure the impact on a before/after basis instead.
We planned to apply all changes across every network on the same day, but that turned out to be harder than expected, even when networks were given advance notice. Because of this, in our before/after analysis, we excluded the days where changes had only been applied to some of the networks. That transition period wasn’t ignored entirely; we analyzed it separately to make sure nothing slipped through the cracks.
4. The risks
The biggest risk came from the networks themselves. A few of them were quite vocal about it, warning that adjusting their default ad template settings could result in a significant eCPM decrease, sometimes as much as 20%.
That said, this wasn’t our first time doing this. We’ve made similar changes on multiple occasions over the years and never been able to pin an eCPM drop to them. A couple of things were different this time around, though:
- The templates had never been as aggressive as they are now.
- We now have better tools available to track not just eCPM, but metrics that actually tell us whether ad quality is improving.
Taking all of that into account, the client agreed with us that the risk was worth it, and we moved forward.
5. The Impact Measurement
As mentioned, the main goal was to improve ad quality without reducing ad revenue. That’s why a large portion of our analysis was centered on tracking how eCPM moved after the new ad templates went live.
On the quality side, we used Unity’s Ad Quality tool to measure the impact.
From all available metrics, we chose to focus on:
- Ad duration
- D1, D3 and D7 churn
We broke down eCPM data by game (Game 1, Game 2, Game 3), platform (iOS and Android), ad network, and geo, with particular attention to English-speaking countries.
6. Control Factors
eCPM is notoriously unreliable as a standalone metric, something I wrote about a couple of years ago in this article. In short, eCPM is influenced by so many variables that analyzing it in isolation doesn’t tell you much. With that in mind, we tracked the following:
- % DEU (Daily Engaged Users) that were IAP Payers (vs. IAP Non-Payers)
- % DEU coming from UA sources (vs. Organic Users)
- % DEU coming from different countries
The logic: the higher the proportion of DEU that are IAP payers, who come from User Acquisition, or come from English-speaking countries, the higher the eCPM will be.
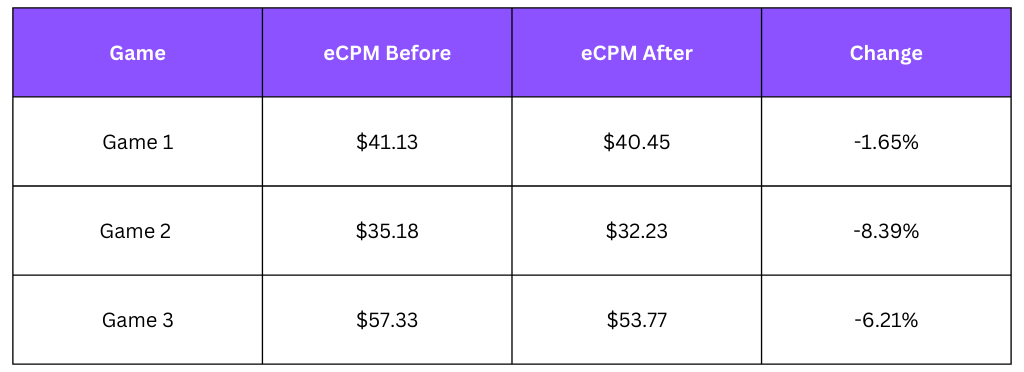
7. The eCPM Impact
iOS
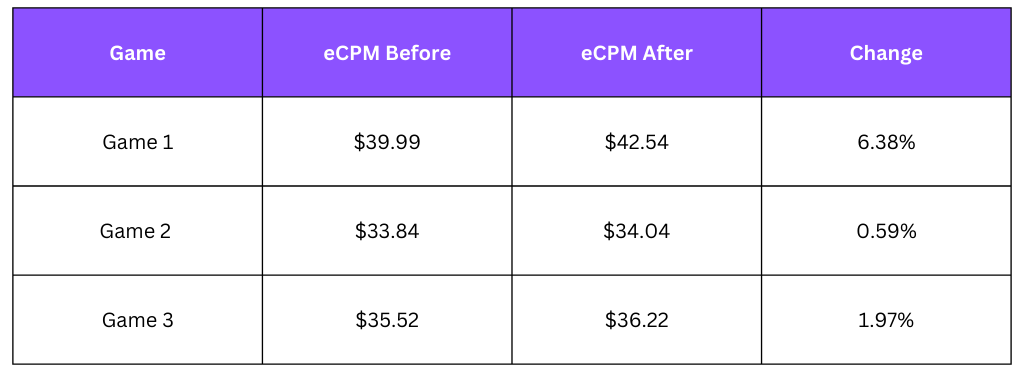
Android
8. Results
The tables show some eCPM decline on iOS and no decline, actually a slight increase, on Android. So what’s behind such different outcomes from the same set of changes?
It’s not just the changes themselves. Remember, we were also tracking how many ad viewers are payers, how many came from UA, and what the geo breakdown looked like. That context matters a lot here.
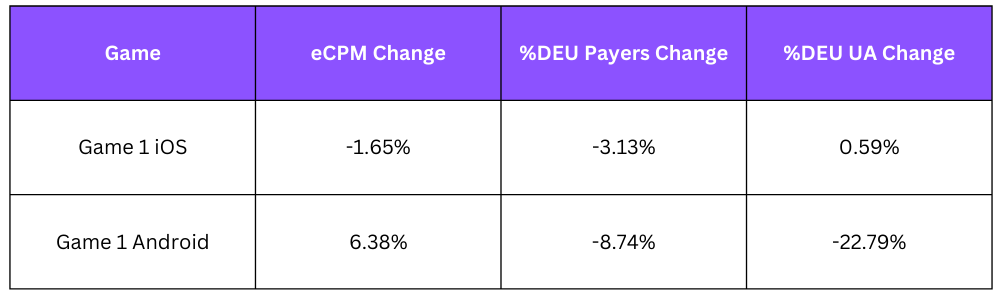
On iOS for Game 1, the shift in viewer composition is the more likely explanation for the slight eCPM drop than the template changes themselves. A marginally higher share of ad viewers from UA (+0.59%), combined with a drop in the share of payers among ad viewers (-3.13%), pulled eCPM down compared to the baseline.
On Android, eCPM held up, or actually improved, despite those control metrics trending negatively. That tells its own story.
One final note on eCPM movement: it fluctuates every single day based on changes in demand. There’s a level of randomness here that we treat as noise, since there’s not much that can be done about it.
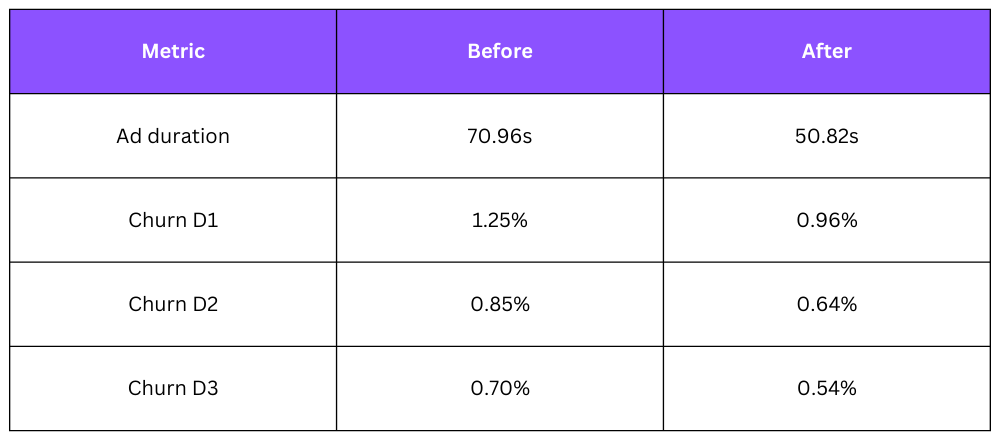
9. Ad Quality Impact
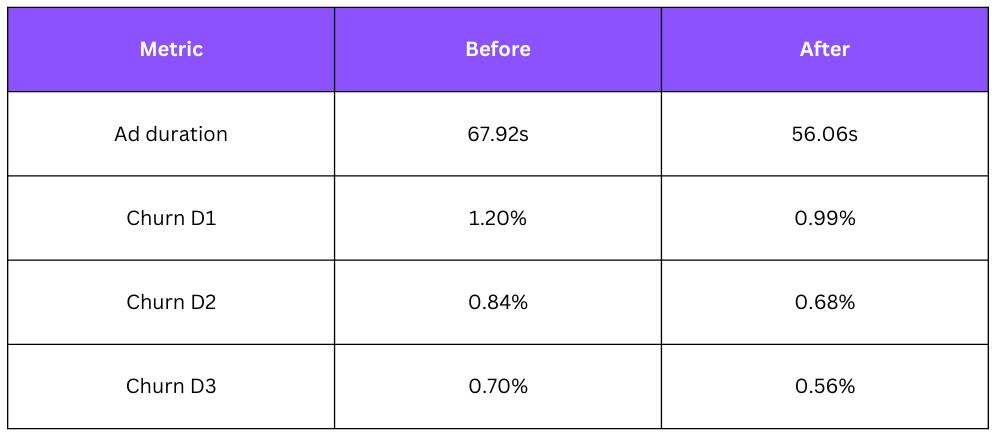
Here’s a look at what happened with ad duration and churn when we updated the default ad templates.
Game 2 iOS
Game 2 Android
We saw a consistent pattern across Games 1 and 3 as well.
- Ad duration dropped between 12.8% and 28.4%, depending on the game.
- Churn decreased across all games.
We also noticed that the share of impressions going to the networks with the highest churn rates, in this case Applovin, Moloco, and Mintegral, fell from 40% to 35%. It’s plausible that with ad templates more closely aligned across networks, other, less aggressive networks got a fairer shot at winning the auction.
10. In Conclusion
Running experiments with ad templates and blocklists is absolutely worth the effort. This test confirmed what we’ve seen before: there’s no evidence that moving to more conservative templates across networks causes a meaningful eCPM drop. In practice, we were able to keep ad revenue intact. And at the same time, we saw a clear reduction in average ad duration and in the number of players churning from ads.
To be clear, experiments like these take real work, applying changes across dashboards, submitting requests to networks that don’t offer self-serve options, analyzing eCPM alongside control parameters, ad duration, churn, and getting Unity Ad Quality SDK in place if it isn’t already.
The reward, if it works out?
Stable ad revenue and a noticeably better player experience.
If you need help with any of this, don’t hesitate to reach out! 😉
You might also like


Home of the Gamesforum events series and leading mobile game analysis. Discover everything you need to know about mobile games marketing and monetization.